Every Route.
Optimized.
Every Stop.
Exact.
STOPPING TOLERANCE ±2mm · PAYLOAD 1,500 kg · BATTERY 16h CONTINUOUS

360° SCAN · 80m RANGE · 0.1° RESOLUTION
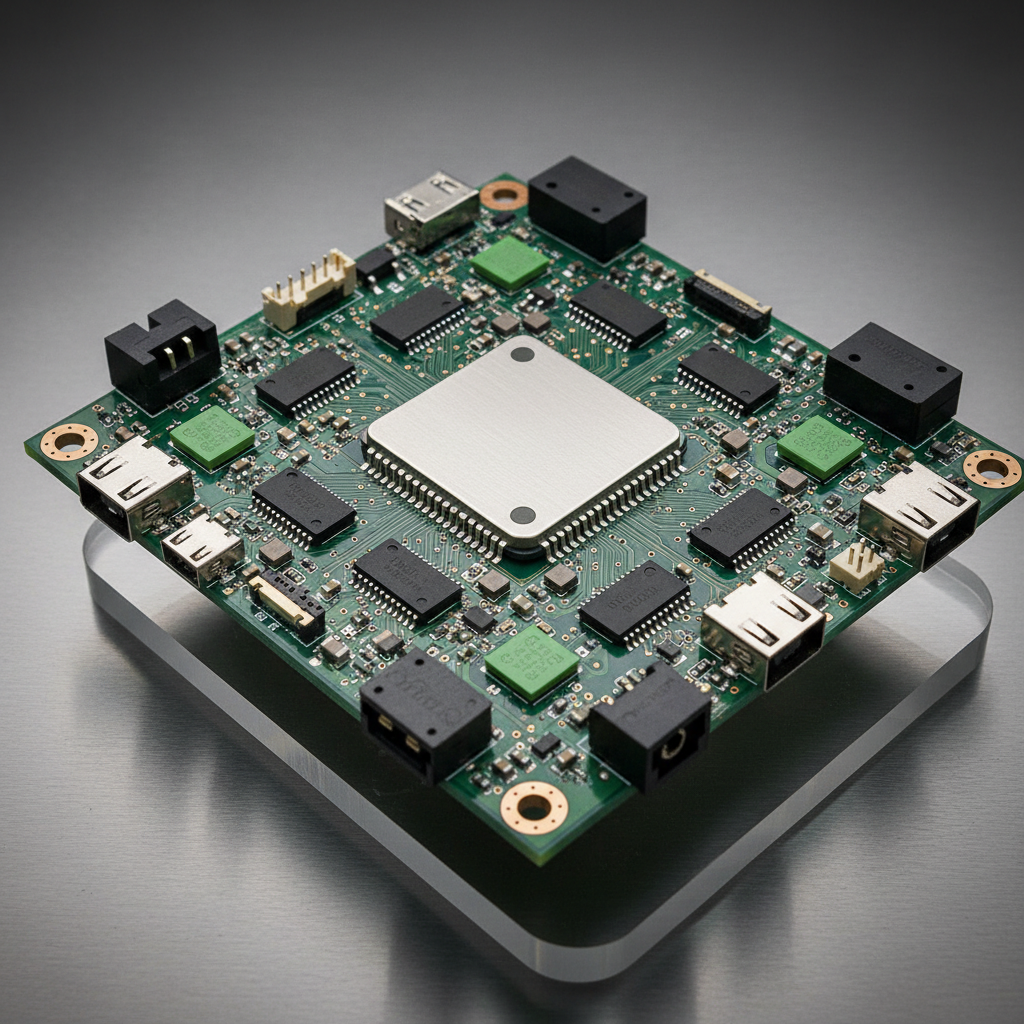
OMNIDIRECTIONAL · 360° ROTATION · 2.5 m/s MAX
±2mm
Stop Tolerance
1,500 kg
Max Payload
Hard Numbers.
Zero Ambiguity.
Aggregated across 47 active facilities, 12,000+ operational hours logged in FY2025.
Incident Reduction
vs. manual forklift baseline
Throughput Gain
peak shift performance
Avg. ROI Payback
full deployment to breakeven
Navigation Uptime
across all active fleets
Forklift Incident Rate
Per 100,000 operational hours · Industry average vs. Convoy fleet
ROI Payback Timeline
Modeled on 50,000 sq ft facility · 2-shift operation · 8 AGV deployment
See Every Route.
Eliminate Every Bottleneck.
Convoy's SLAM-based mapping generates a live digital twin of your facility, continuously re-optimizing traffic flow across every shift.
Shift Throughput Comparison
Pallet moves per 8-hour shift · Same facility footprint
Manual Forklift (3 operators)
Semi-Automated (1 supervisor)
Convoy Fleet (8 AGVs)
↑ 342% throughput increase · Same facility · Same square footage · Zero additional headcount
Stopping Accuracy
Laser triangulation
Obstacle Response
Emergency brake latency
Battery Cycle
Single charge, full shift
LiDAR Resolution
360° continuous scan
Named Facilities.
Verified Outcomes.
Not projections. Measured results from production environments, independently audited.
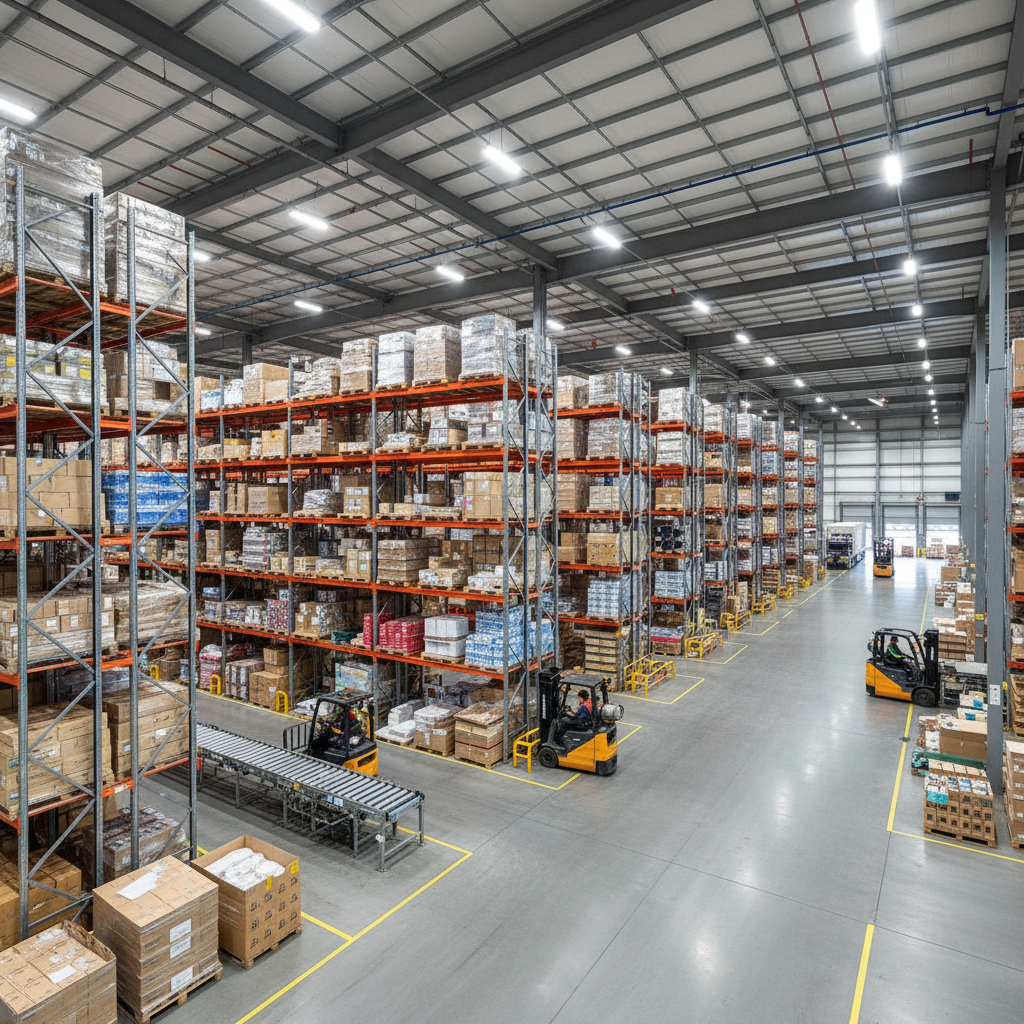
Meridian Logistics — Louisville, KY
Meridian Logistics — Louisville, KY
"We went from 14 forklift incidents in 2023 to zero in 2025. The ROI conversation became a formality."
14 → 0
Forklift incidents (annual)
+387%
Pallet moves per shift
16 mo
Full capital recovery
$2.1M
Year-2 net savings

Stonecroft Manufacturing — Spartanburg, SC
Stonecroft Manufacturing — Spartanburg, SC
"Lights-out Saturday operations — no supervisors on floor, zero incidents. That's the headline for our board."
100%
Lights-out weekend ops
+290%
Parts pick rate
22 mo
Payback period
$890K
Annual labor reallocation
Trusted by operations teams across
Your Facility.
Your Numbers.
A Convoy systems engineer will map your current material flow, model AGV deployment across your layout, and return a facility-specific ROI projection within 5 business days.
Facility Scoping Call
45 min with a systems engineer. No sales pitch.
Digital Twin Generation
We model your floor plan using your CAD files or a site visit.
ROI Projection Delivered
Incident reduction, throughput gain, payback timeline — your numbers.
Not ready to talk?
Download our ROI Calculator. Model your own numbers in Excel.
Facility Details
Tell us about the space we're optimizing.
Ready to see your facility numbers?